
Next, go ahead and open a trace file containing a TuningFork feed by selecting Open Trace from the File menu. A separate downloadable package available from the TuningForkVP SourceForge project contains example trace files. The 2.0.0 release of sample-traces contains two sets of example trace files: a single file called instrumentedClient.trace that was generated by running the instrumentedClient.java program from the JavaTraceGenerationExampleClient project and a set of trace files in the jbb-4w-30s-rvm directory that are a vertical profile (Application, Virtual Machine, Operating System) of an instrumented SPECjbb2000 application running on Jikes RVM and Linux.
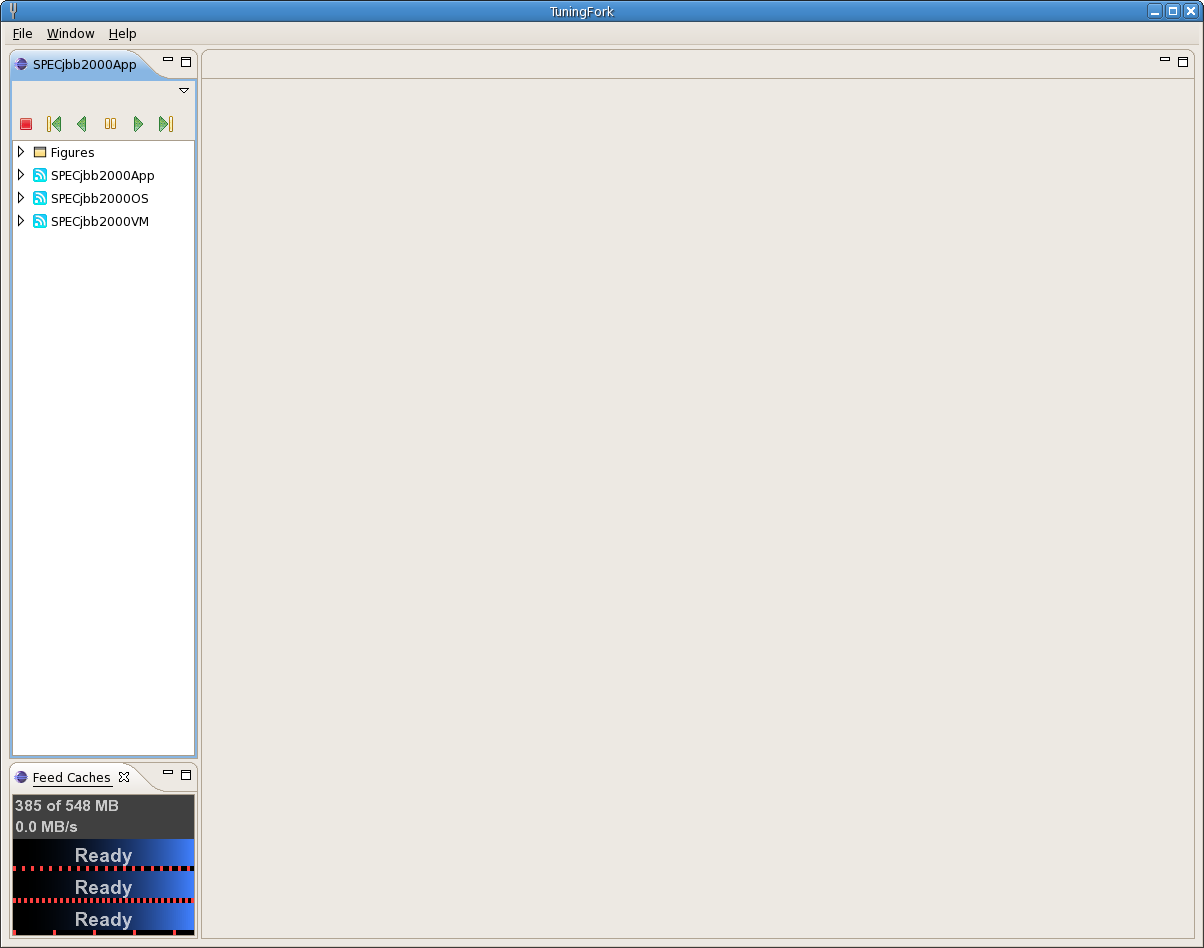
The screenshot above shows the workspace right after the example trace files
SPECjbb2000App.trace,
SPECjbb2000OS.trace, and
SPECjbb2000VM.trace
have been opened.
Since all of these feeds overlap in time, they are placed in a single Feed Group Explorer
(on the left).
The Feed Group Explorer is the primary way in which
you will manipulate Feeds, create new Streams, and define and open Figures.
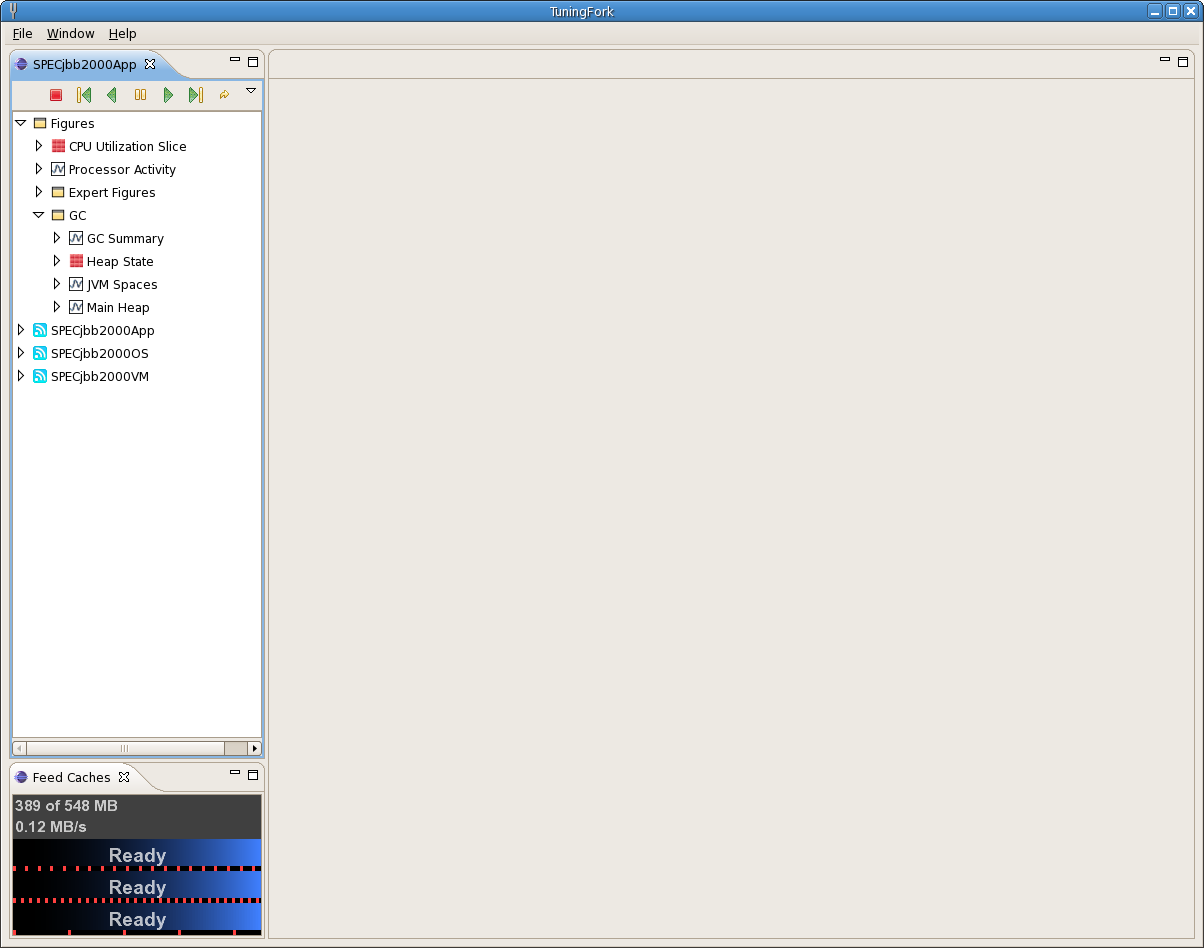
The next thing to try is to open a Figure. All of the predefined Figures will be
found grouped under the "Figures" node at the top of the Feed Explorer. The screenshot
below shows a partially expanded Figure list for the sample trace files.
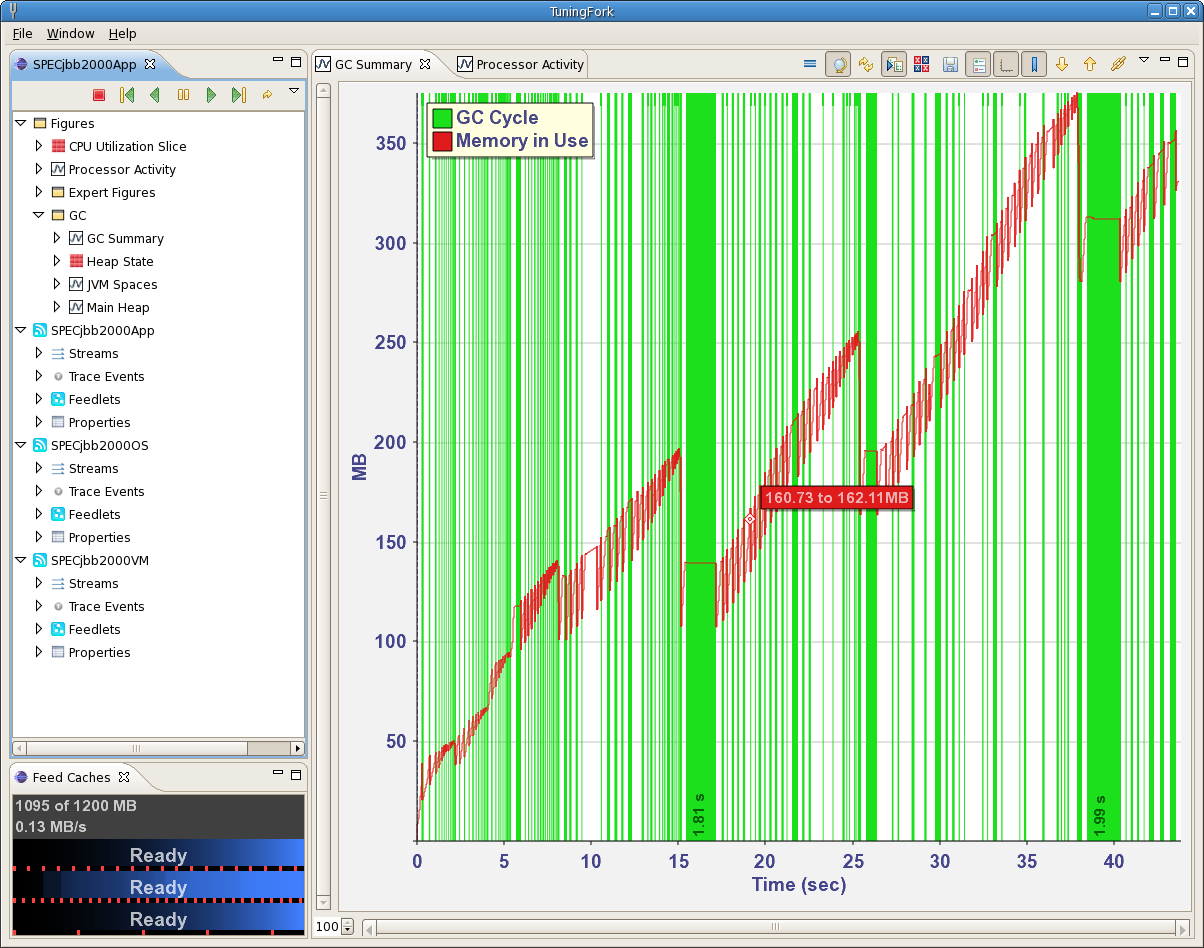
 You can open a Figure by double-clicking on its node in the Feed Explorer. The
screenshot below shows TuingFork after the GC Summary Figure has been opened zoomed-all
and the various Feed nodes expanded to show their children
(Streams, Trace Events, Feedlets, Property).
Continue exploring TuningFork by opening other Figures and/or manipulating already opened Figures. Detailed instructions for the various parts of TuningFork can be found in the reference portion of this online help. However, we've tried to utilize common UI idioms and direct manipulation as much as possible so you may be able to get quite far via exploration and experimentation without actually reading the whole manual.
Note that you are able to create figures by selecting streams from multiple feeds within
the same feed group to build up visualizations of the entire profiled stack. You can also
time synchronize (![]() ) all of the open figures
to cause them to display the exact same time window (start time and duration).
) all of the open figures
to cause them to display the exact same time window (start time and duration).
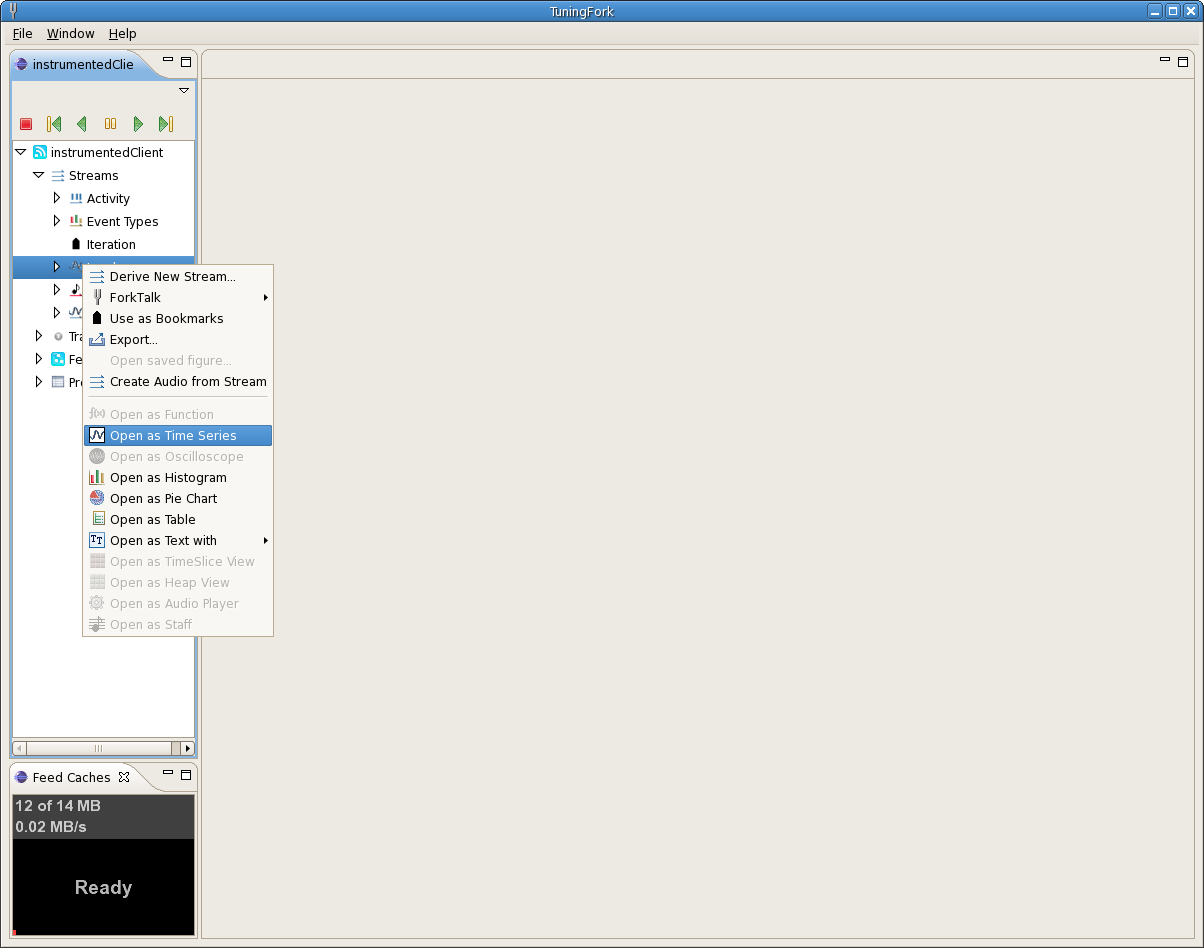
You can also open figures and derive new streams by right-clicking on one or more stream nodes
in the Feed Explorer as shown in the screenshot below.
